
Buyers, Your Window of Opportunity Is Closing! The GSMR for September, 2026

Welcome to Q4 of 2026! It's hard to believe we're already there, but back are the days of early sunsets, pumpkin spiced everything, and in the case of real estate, disappearing inventory. I've written about this ad nauseum over the past few years. If you've paid attention to these market updates with any decent amount of frequency, you know what's coming. Yes, we're going to talk about seasonal inventory. Especially the drastic disappearance of inventory we start to see post Halloween every year.
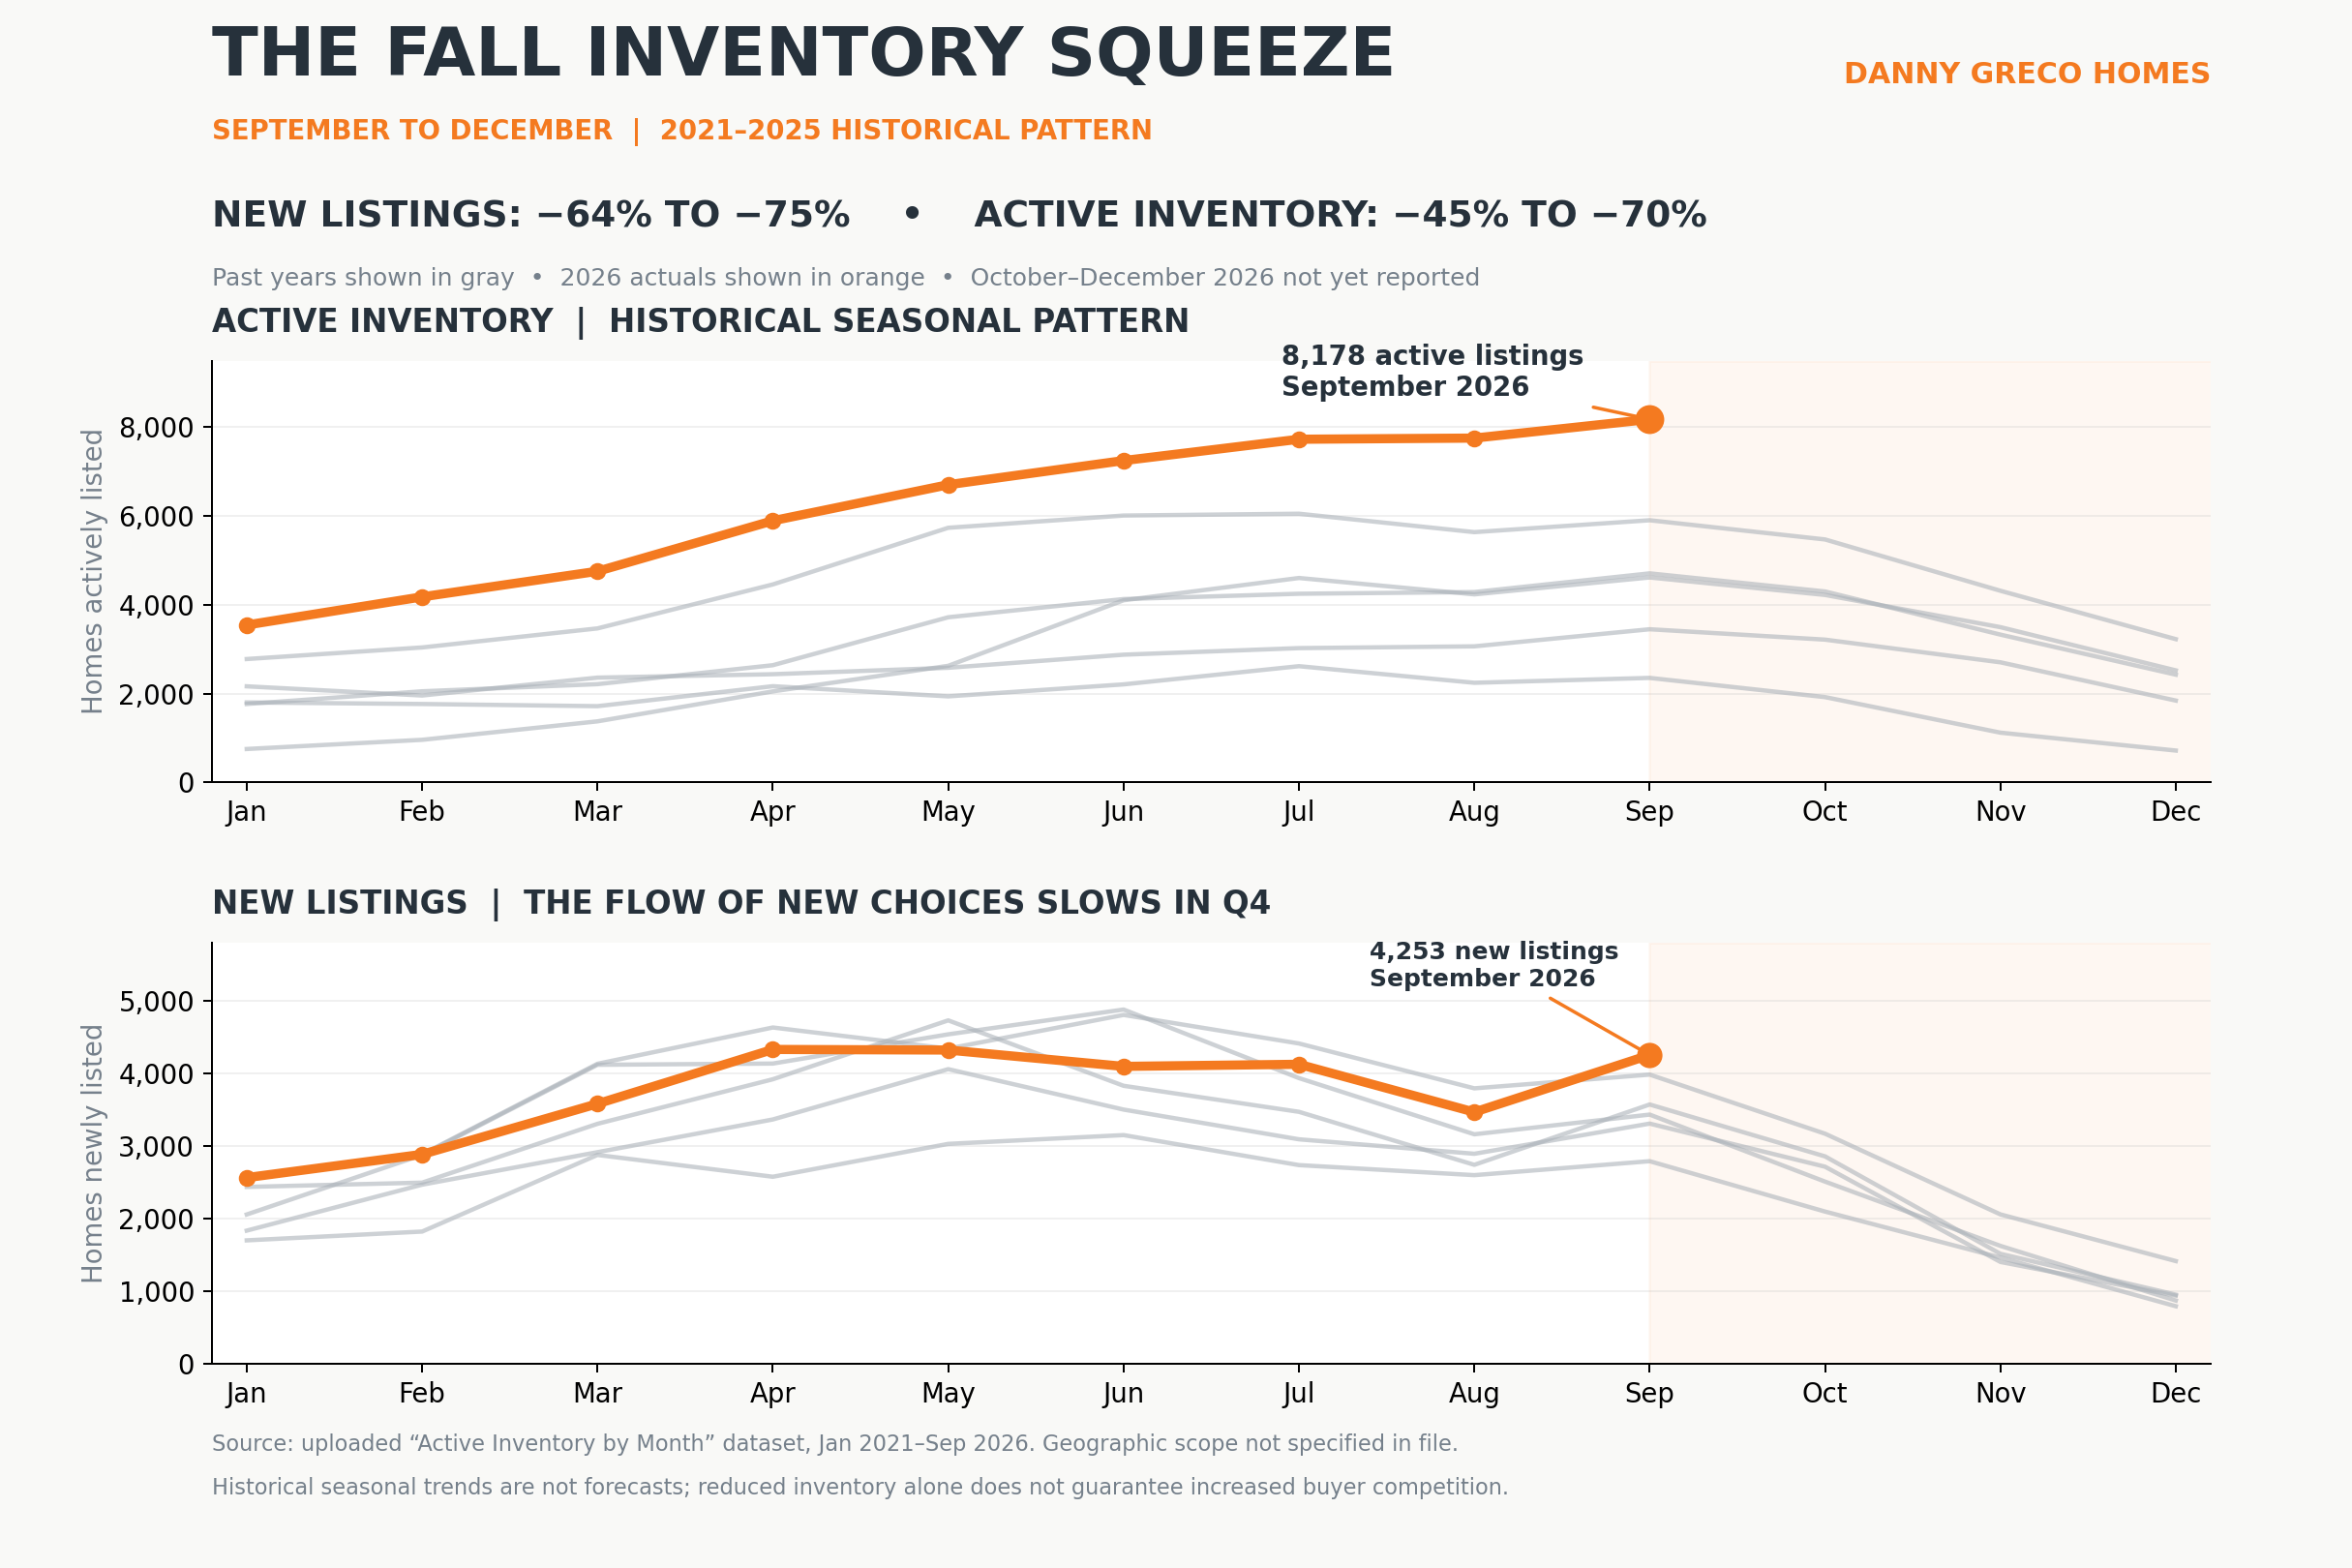
Check out the charts above. As of this exact moment (mid October when I'm writing this) we are at peak inventory levels. This is usually the case any year between the months of August and October. However, once sellers wake up on November 1st, hungover from some serious Halloween sugar highs, inventory starts declining at a rapid pace.
Over the past 5 years, new listing inventory has declined anywhere from 64-75% between September and December. Meanwhile, total active inventory declined 45-70% in that same period. This is across the single family and condo market combined.
The contrarian will (accurately) point out; Yes, but 2026 levels of active inventory are well ahead of any other year for which this is tracking. That is very true, yet it doesn't mean that the opportunities existing at this time in the market are going to be available in Q1, let alone by the end of the year.
And what else do we know about the beginning of the year? It's when buyer activity is at its strongest levels! So not only are many of the houses sitting on the market going to get pulled between today and Q1, but even more buyers will enter the market. In some cases, that will bring a return of multiple offer situations for those highly desirable homes free of flaws, priced right, and in desirable areas.
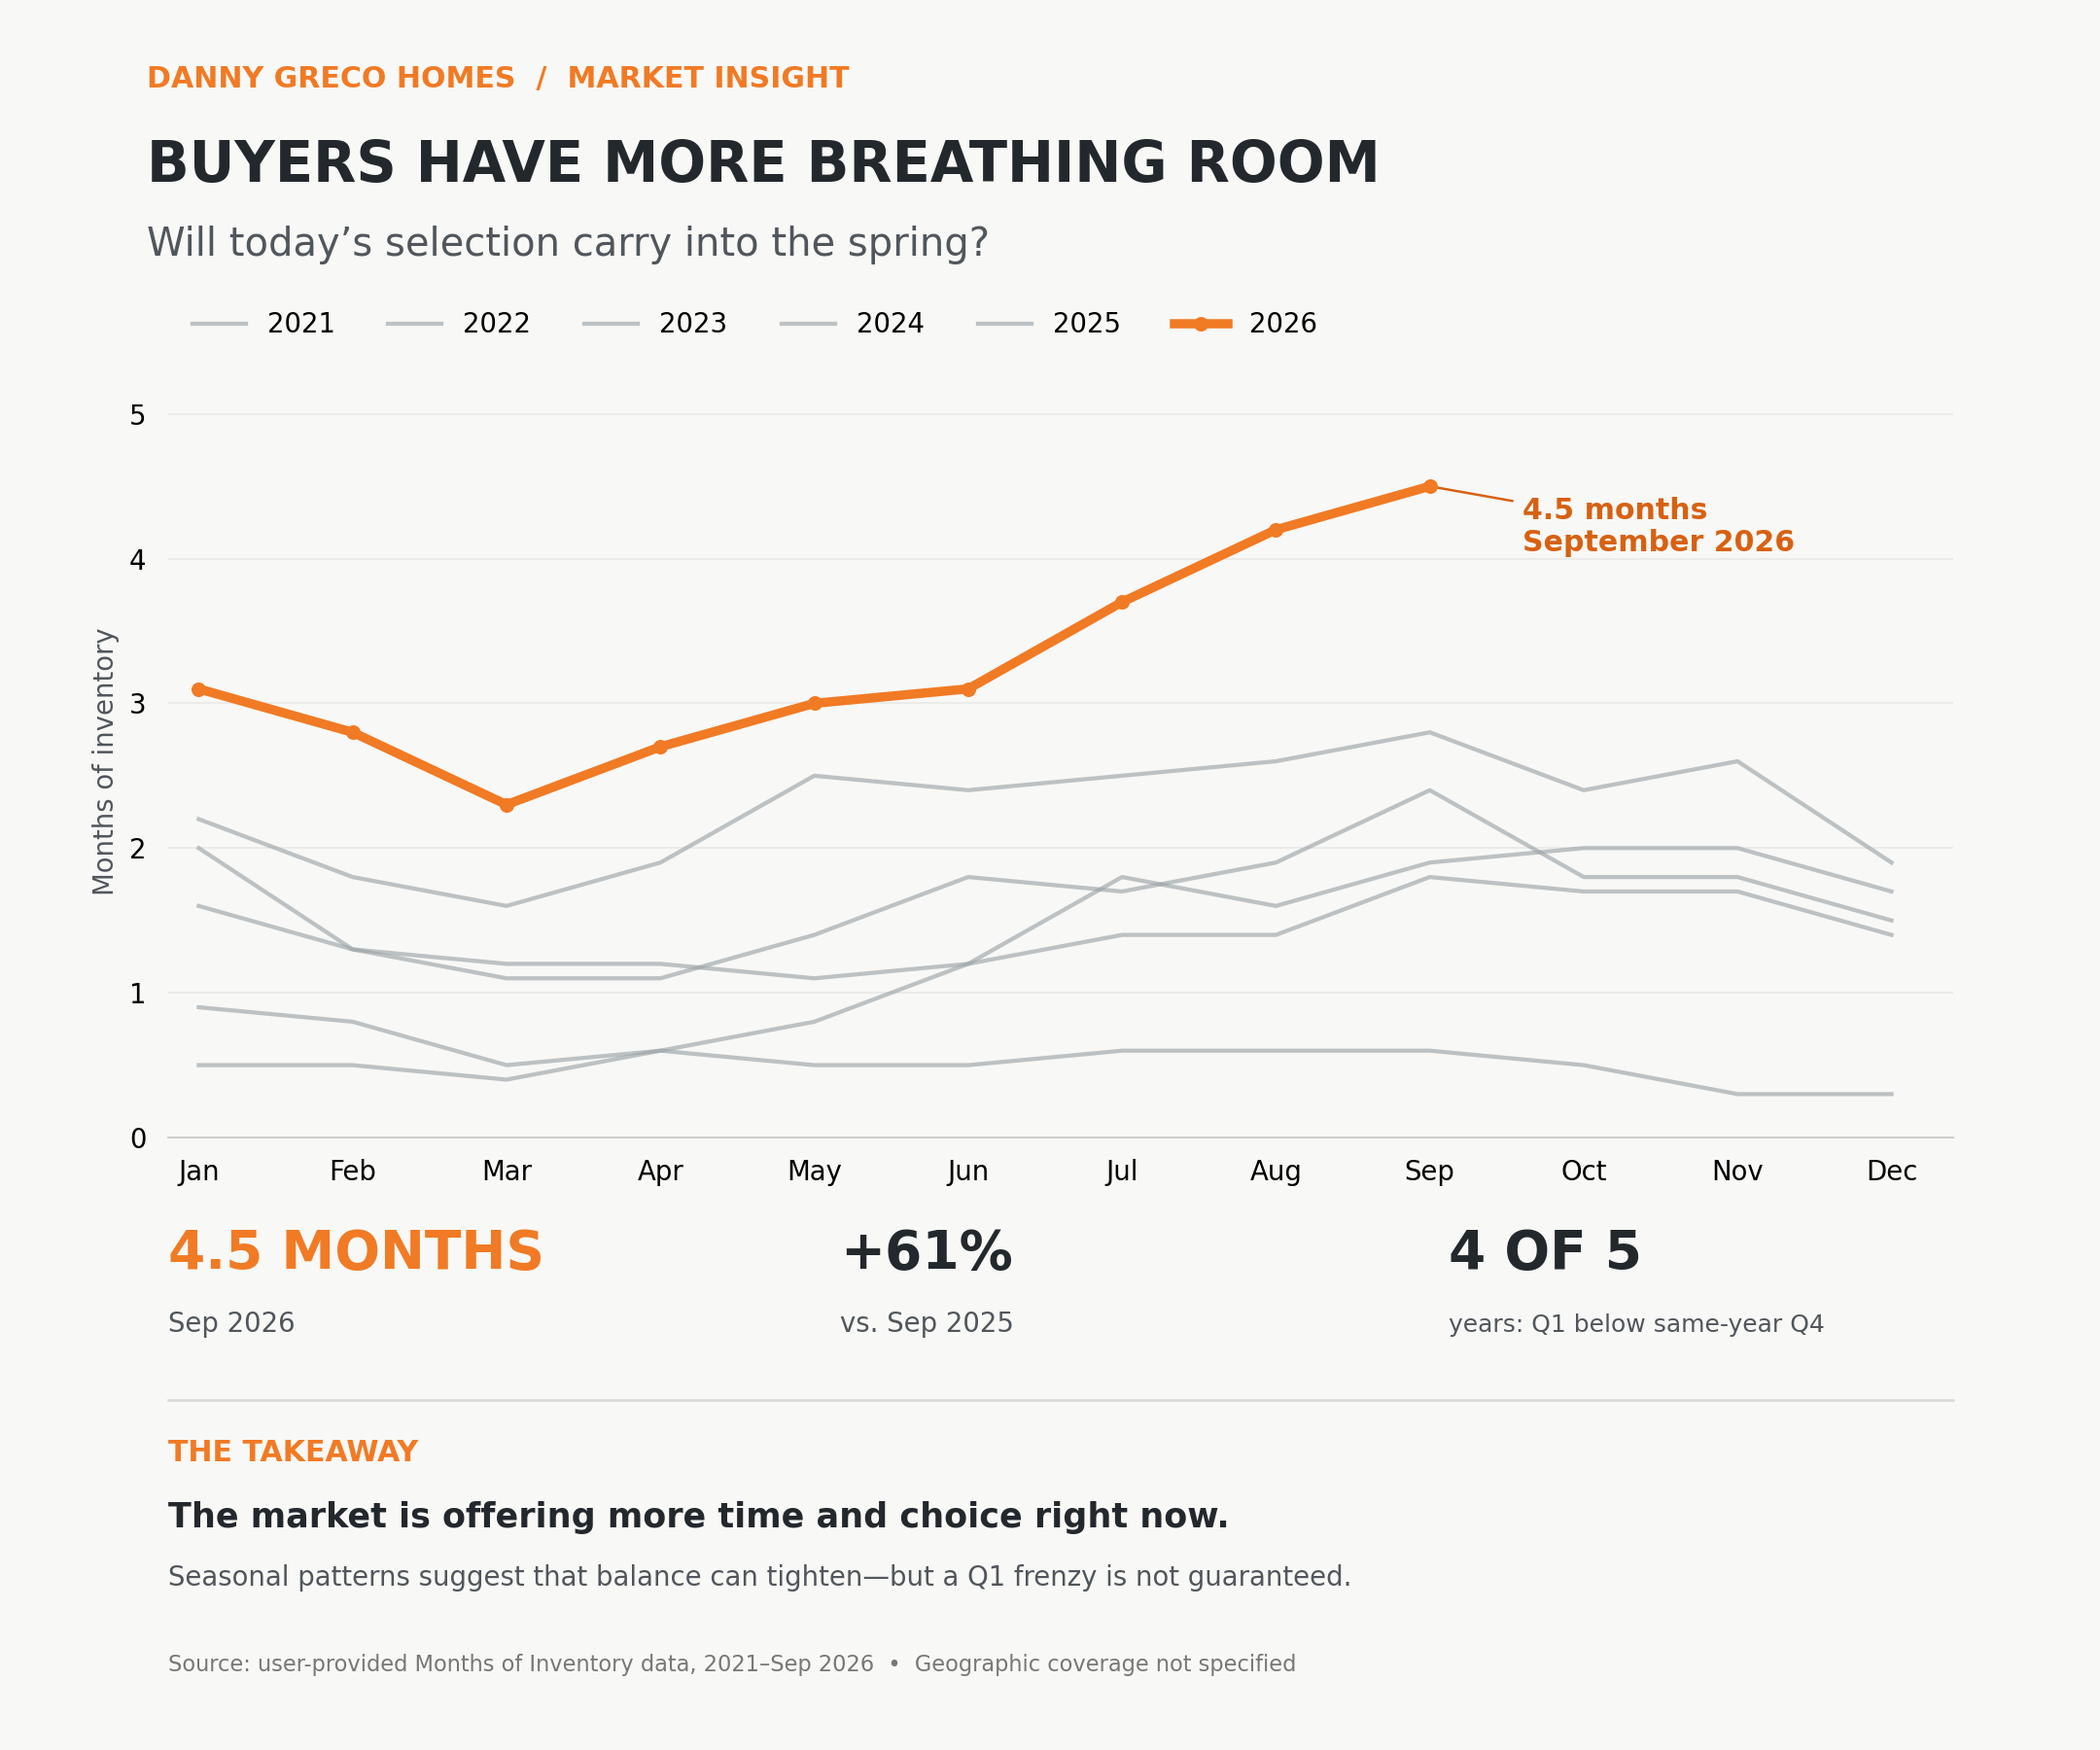
The above chart is the months of inventory statistic for the same King county SFR and condo market. This is really the best metric to measure buying activity; the lower the months of inventory, the stronger the sellers market and buyer demand. For context, 2.5-3 months is a pretty neutral market. Before this year, we only barely scratched neutral territory. As of September, we're definitely entering a more buyer friendly market (again, keep in mind this is combining both the SFR AND condo market). Expect this number to decline once November's data becomes available and we will likely stay within those seller friendly levels through May of next year.
I joke that this time of the year, every year, makes me feel like I'm one of the religious wackos preaching into a megaphone outside a sporting event. The people I'm preaching to rarely seem to acknowledge or hear me, let alone take my warnings into consideration. Maybe this year will be different? The rapture awaits! jk
Onto the stats:
Seattle - The medisan sale price registered $960,000. That is down 1.5% YoY though up from $920,000 MoM. Inventory was up 24.7% YoY and the months of inventory statistic rose to 4.15 months from 3.41 the month prior.
Eastside - The median sale price registered $1,425,000. That is down 9.5% YoY and down $20,000 MoM. Inventory is elevated at 49% more YoY and the months of inventory increased to 4.36 months from 4.24.
King County - The median sale price registered $949,975. That is down .73% YoY and up from $920,000 the month prior. Inventory is up 36% YoY and the months of inventory increased to 4.1 months from 3.61 the month prior.
Seattle condo - The median sale price registered $530,000. That is up 1.2% YoY and down just $5,000 from the month prior. Inventory is up 14.2% YoY and the months of inventory increased to 8.3 months from 7.77 the month before.
8.3 months of inventory is by far the most I've seen for the entire city since tracking this figure back in 2019. Also, without surprise, the absorption rate reached another all time low. This is now the 5th month in a row that this figure has hit an all time low, once each after the previous record low month.
That's it. Enjoy Halloween! Onward!