Don't Trust the Headlines! The GSHMR for April, 2026
Welcome to the latest edition of The Greater Seattle Housing Market Review. As always, to skip right to the video discussing last month's stats, you can do so by clicking here. For more detailed information, continue reading below.

As if legacy media wasn't already becoming increasingly untrustworthy, it's articles like this one that make gag. Those who don't know, Nick Gerill is a complete hack. He has the title "housing analyst", but the guy is nothing more than a housing doomer who has been calling for a housing market crash for years, and he's still yet to be right. Furthermore, he cowardly refuses to have debates with true housing experts who actually know what they're talking about. It's shameful our local publications bothered to pick up this pile of garbage and offer it more publicity than it deserves. Nonetheless, I digress, but not before I felt so compelled I had to offer my own $.02, here. Just another reminder to NEVER trust headlines.
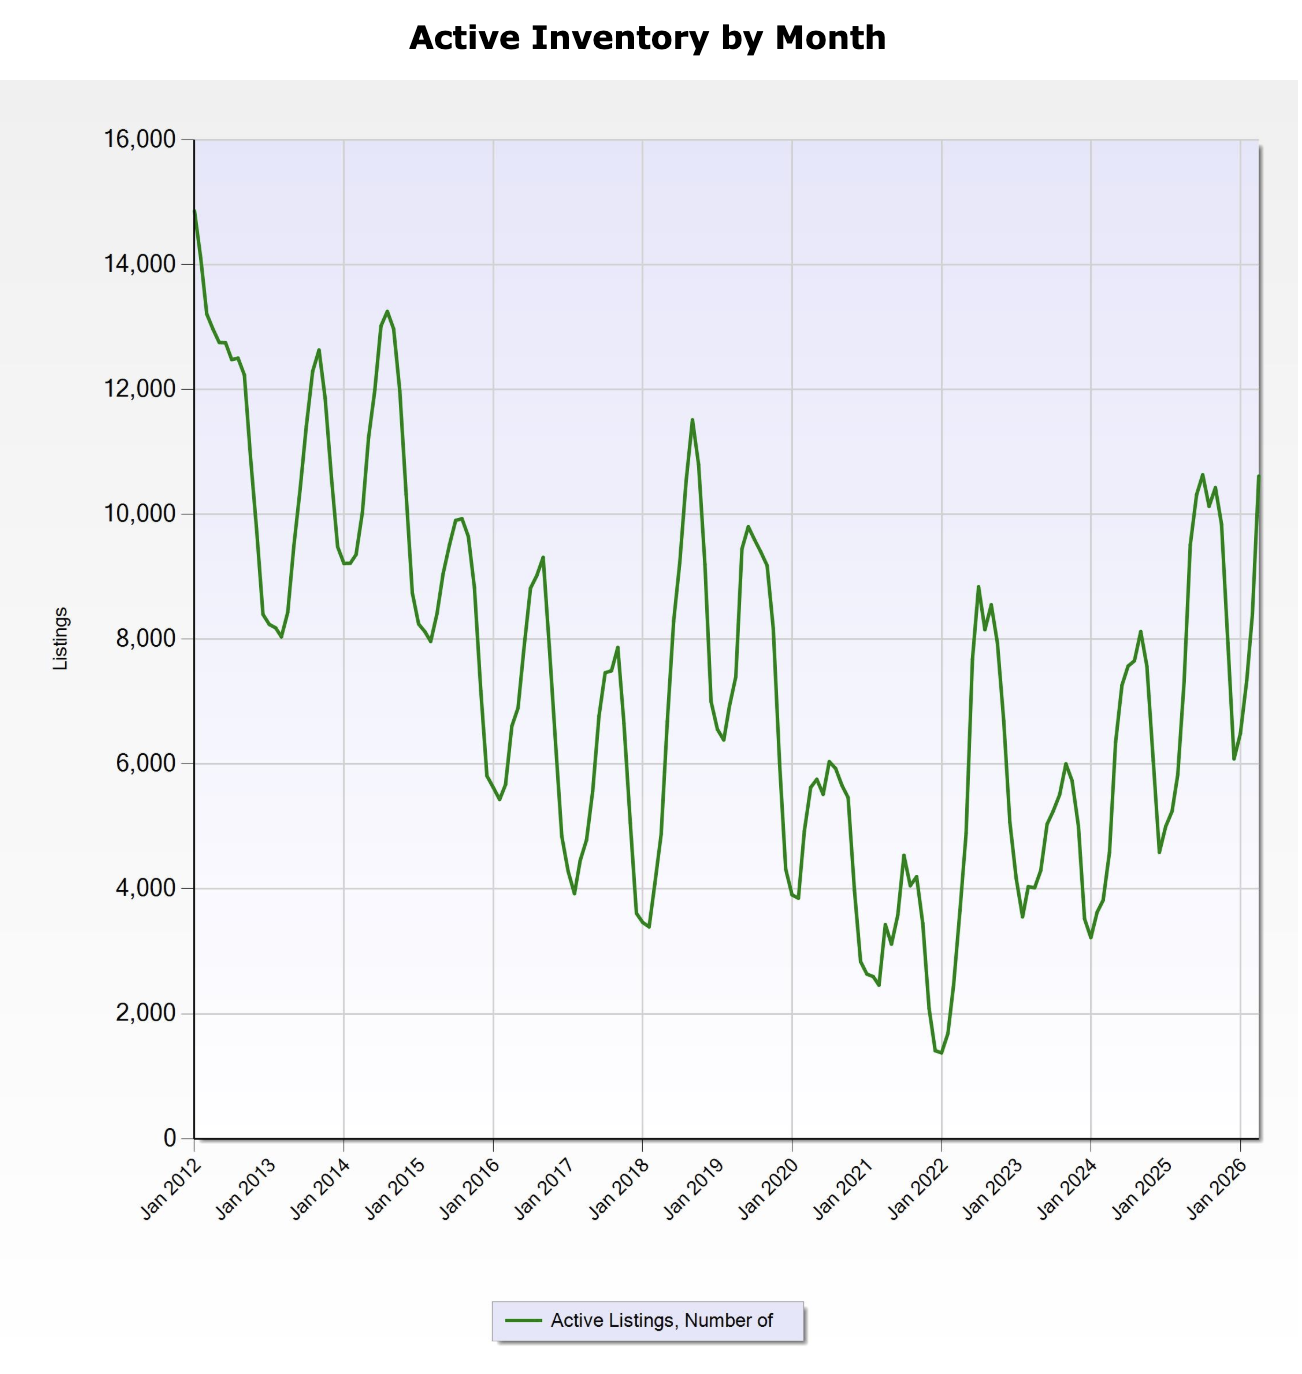
Now don't get me wrong, I'm not committing the same sin by sugarcoating everything is all sunshine and rainbows within our local housing market. The graph above is charting the total number of homes and condos for sale across King, Snohomish, and Pierce counties over the last number of years (consistent with Gerill's "reporting"). With the exception of June through September last year, we have to go back to 2018 before we've seen inventory at the level we saw last month.
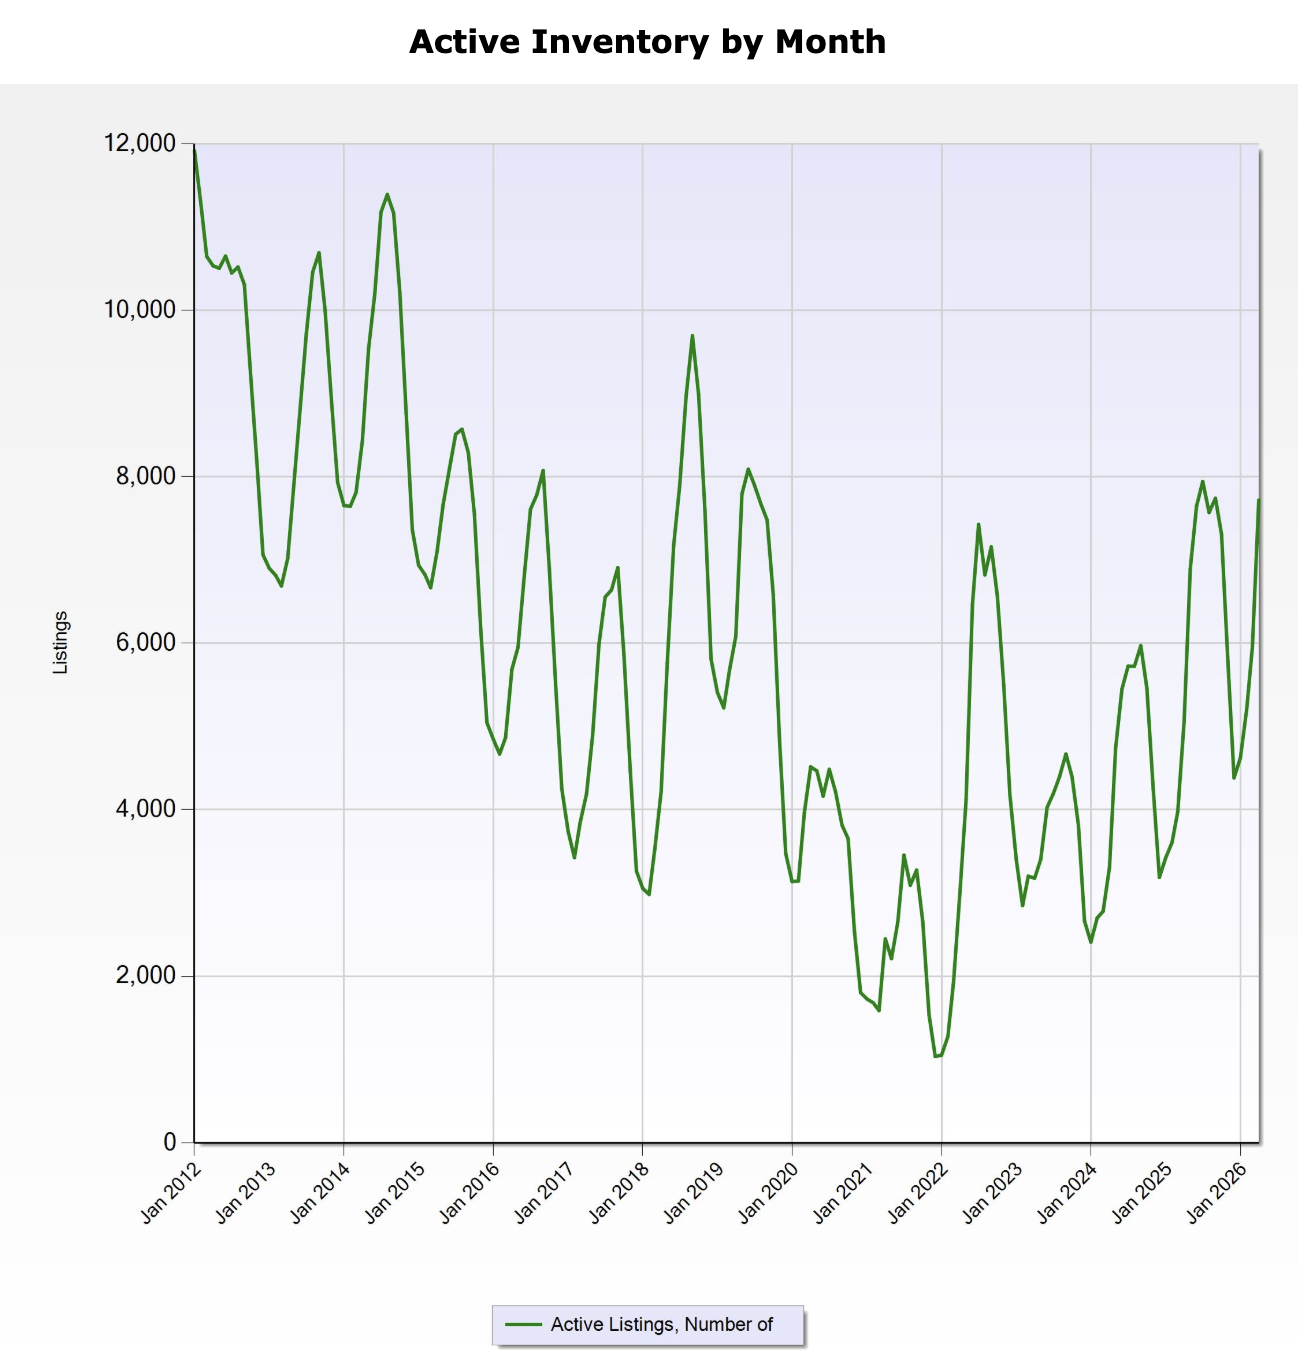
Above is what the chart looks like if we remove condos from the equation. From here we see that, while we're still at relatively elevated levels of inventory, it's not the unfamiliar territory suggested by our news outlets. Granted, it was just last year, and then back in 2018 and 2019 when we saw similar levels of inventory, but this isn't some unprecedented time these unknown keyboard jockeys are trying to have you believe. What will be very interesting to watch as we get into the more listing heavy months of the year will be how inventory adds up. Especially if interest rates and affordability remain volatile. More on that below:
The following came to me courtesy of Peter Zevenbergen from NEO Home Loans. I felt it provided some very accurate context in regard to inventory and our housing market:
"This is what a normalization process looks like. We are not seeing a housing crash. We are seeing inventory slowly rebuild while price growth cools off enough for incomes and inflation to begin catching up. Think of it like a treadmill finally slowing down after being stuck at sprint speed for several years. Buyers who felt like the market was running away from them are starting to regain footing. The failed spring selling season is part of that story too. Demand has softened just enough to create breathing room without creating distress. Homes are sitting longer, negotiations are returning, and buyers have more choices than they have had in years.
The important takeaway for our clients is this; Affordability does not always improve because prices collapse. Sometimes it improves because time does the work. If inventory continues rising while home price appreciation stays muted, and if income growth continues moving higher, we could see a multi year stretch where housing becomes progressively more affordable in real terms even if nominal prices stay mostly flat. That is a very different outcome than the doom and gloom headlines many people are waiting for, and honestly, it is probably a much healthier one for the long-term stability of the housing market."
Onto the stats:
Seattle - The median sale price for a SFR in Seattle for April 2026 registered at $998,899. That is down 2.55% YoY and up MoM from $944,000. Inventory was up 27.5% YoY and the months of inventory stat rose to 2.25 months from 1.99.
Eastside - The median sale price registered at $1,612,000. That was down 5% YoY, yet up MoM from $1,550,000. Inventory was up 51.1% YoY and the months of inventory increased to 3.48 months 2.85.
King County - The median sale price registered $960,000. That is down 6.8% YoY and down MoM from $975,000. Inventory was up 36.7% YoY and the months of inventory increased to 2.5 months from 2.23 the prior month.
Enjoy the beginning of summer! Onward!