A shrinking window of opportunity. The Greater Seattle Housing Market Update, August 2025
And welcome to the latest edition of the Greater Seattle Housing Market Update. As always, to skp the good stuff and go right to the stats, you can watch a video by clicking here. For the rest of you, continue below!
We're smack dab in the middle of what I call the "opportunity season" for buyers. What I mean by that is this; we're no longer in the scarcely listed months of the year (Q1 and early Q2) that are historically a seller's best friend where they capitalize on strong buyer demand and minimal competition from other competing homes for sale. Inventory levels are increasing month by month (and will likely continue to do so for another month or two), but we might be beginning to see this window of opportunity starting to close on buyer's.

Happy to, Seth! See below!

I apologize, the chart above is a little messy, but the point I want to convey is this; while overall inventory for SFR homes in King County are at their HIGHEST levels since June of 2019, new listings have now declined month over month for the third straight month. The new listing data is a leading indicator to overall inventory so what I expect to see over the next 1-2 months is overall inventory increasing before we see significant drops in Q4 (November, specifically).
Buyer's if there is a window of time where you can maximize your chances to get into a home 1) without competing against other buyers, 2) without waiving contingencies, and/or 3) negotiating the home at or under the asking price, the data suggests THAT TIME IS NOW! Note, this is not me encouraging you in attempting to time the market. If we've talked before then you know I never preach timing the market. Buy when the time is right for you and your lifestyle. Still, the data is hard to ignore the opportunity it presents every year at this time.
Furthermore, and just for fun, I'll assume the role of playing devil's advocate as to why this window of opportunity might be closing quicker than we would expect.
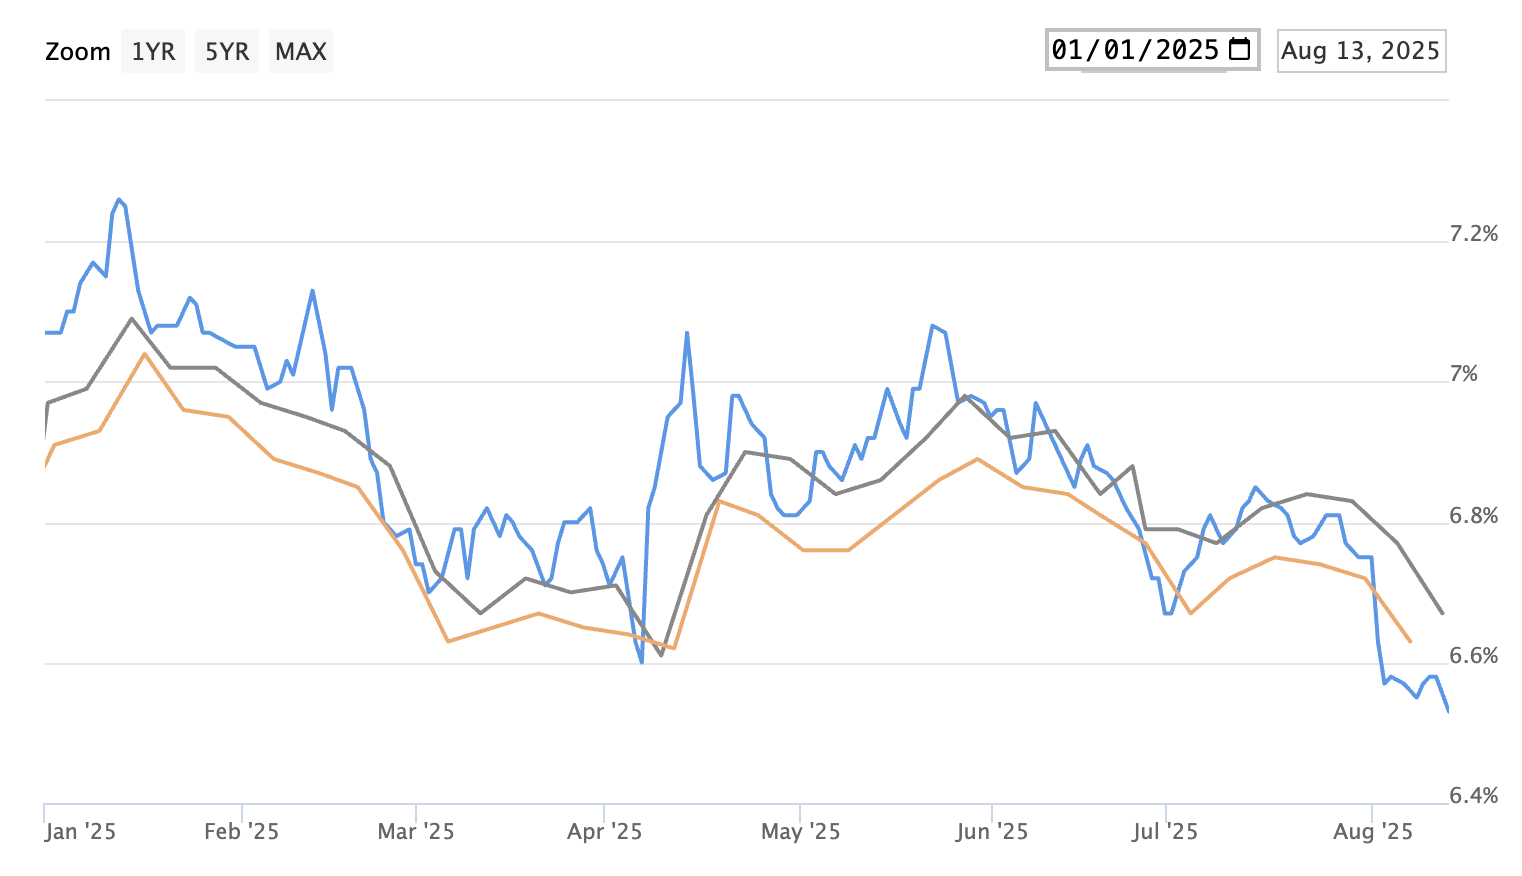
See the graph (blue line) above charting the 30 year mortgage rate YTD. At the time I'm creating this article, interest rates are not only at their lowest level of the year, but at their lowest levels since October of last year. This has primarily been driven by favorable news on the tariff front as those have become more settled, and so far, haven't created the long term turbulence many had feared. Again, we're not 100% in the clear here, but so far the markets are pretty comfortable with the outlook on how these will continue to settle. Remember, markets LOVE stability.
I see your interest rates and raise you the general YTD stock performances in both the S&P 500 and Nasdaq, as well as some of our region's biggest employers. Starting with the below S&P 500 and Nasdaq.

The stock market has been on a tear this year. After the crash induced Liberation Day announcements, the overall market has 100% rebounded and continued to push all time highs (at the time of this typing). We're seeing this first hand with some of our regional behemoths (below).

With many homebuyers working for these local economic powerhouses, especially those in the tech fields, it's not uncommon to see down payment sizes tied to the stock price of their respective companies. A stronger performing stock, the more a buyer can draw from that and use toward a down payment, thus increasing their buying power.
Don't get me wrong, layoffs have been taking place left and right YTD (especially in tech), so while the stock portfolios of those still employed continue to bloom, the overall uneasiness may keep those potential buyers on the sidelines until they feel greater stability in their professional future.
Bottom line; 60-90 days from now we can expect to see significant drops in available homes for sale. If mortgage rates continue to stabilize, or even decline while the stock market continues to chart new highs, we could be primed for a very seller friendly and competitive Q1/2 of 2026. This can result in bidding wars, escalated sale prices, waiving of contingencies, etc. Not anything we don't already see most Q1/2 of every year, but perhaps it can be argued we could be on the path of things being more escalated than they have in recent years. Again, just playing devil's advocate here, but it's not the craziest outcome to consider.
Onto the stats:
Seattle: July 2025's median SFR sale price was $1,010,000. That is up 3.9% YoY and down MoM from $1,080,000. Note, this is the 5th straight month Seattle has registered a median sale price of at least $1,000,000. Never before has this been accomplished. Inventory is up 19% YoY and the months of inventory was flat MoM.
Eastside: July 2025 median SFR sale price of $1,580,000. That is down 2.5% YoY and down MoM from $1,610,000. This is the first time all year the median sale price has dipped below $1.6m. Inventory is still up big at 90% more homes on the market YoY, however the months of inventory decreased MoM from 2.64 to 2.54.
King County: July 2025 median SFR sale price of $1,000,000. That is flat YoY, but down MoM from $1,039,000. Inventory is up 43.3% YoY and the months of inventory was flat MoM and remains at 2.4 months.
Enjoy and onward!