Stats, a 50 year mortgage, and layoffs. The GSHMU, November 2025
Welcome to another edition of the Greater Seattle Housing Market Update. As always, to skip straight to the stats, you can do so by clicking here. For more information not mentioned in the video, continue below!
In past write ups, I've referenced seasonality in regard to inventory and buyer demand, but in this edition, I want to focus on Seattle home appreciation, specifically within the first 6 months of the year. Appreciation in our market almost takes place entirely within the first 6 months of every year. January is always the bottom point for the median sales price and then values gain, quite significantly, through the second quarter. In Q3 values stall a bit, and then at the end of the year they dip only to restart their upward trend a few months later once the new year turns over. See below the starting Seattle median sale price in January, June, and the percentage increase.
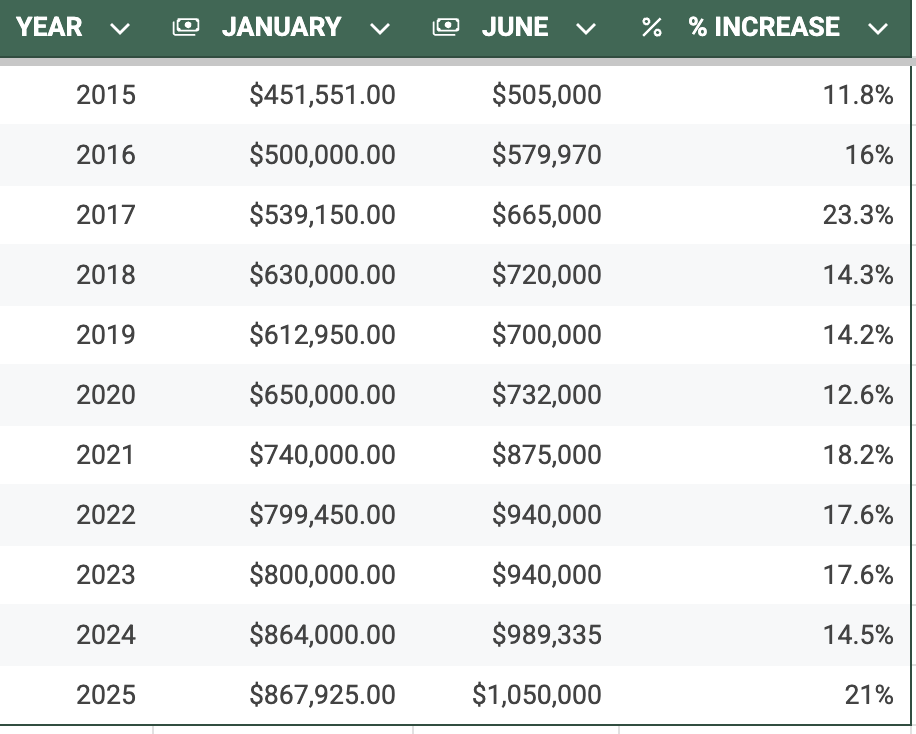
Below charts the relationship in a more viewer friendly version.

What does this mean? First, I'm never one to suggest "timing the market". It's about finding the right home, however long that might take. That being said, the sooner into the new year a buyer finds a home, the less, on average, they're paying. After being provided this information, buyers sometimes conclude that it's best to buy in Q3 or Q4 once values have stagnated or possibly even declined. There's no error in that thinking, but remember this; Pricing a home involves using data of recent sales. Setting a listing price for a home set to hit the market in Q1 means using data from similar sales that took place in Q4. Values decline at the end of the year, but buyer demand often pushes prices above their list price in Q1. On the other hand, Listing a home toward the end of the year involves using data from homes that sold when values were at their peak. 6+ months of appreciation leads to higher list prices. Even though demand isn't what it was earlier in the year and buyers might have leverage to buy the house under the asking price, that final sales price can still often be higher in August than what it would be in February. So just because the market conditions are more buyer friendly, that doesn't necessarily translate into getting the house any less expensive than what was possible earlier in the year despite more competition from other buyers.
Moving on. I'm sure you've heard that President Trump has floated the idea of creating a 50 year mortgage? If not, here's one of the many articles about this. Who knows how much bite there is to this idea, but I personally think it's a terrible idea.

It's true that a longer term mortgage would improve affordability, the benefit President Trump is touting, but that monthly savings would be negligible in the big picture. Don't forget, the longer the duration of the mortgage, the higher the interest rate. On an $800,000 loan, the 50 year option saves about $541/month, which is not insignificant, however the equity build up really slows down with a 50 year term. When you're paying so much in interest those first years, you don't start paying off significant amounts of principal until much later on in the amortization schedule compared to a 30 year alternative. In fact, over the life of the loan, the borrower taking out a 50 year mortgage ends up paying roughly $900,000 MORE in interest on this $800,000 example! See below:
Metric. 30-yr 50-yr Difference
Monthly Payment $5,096 $4,555 -$541
Total Interest $1,034,584 $1,932,989 + $898,405
I'm all for affordability, but not at the expense of equity. And certainly not at these proportions.
And finally, the elephant in the room, the recent layoff situation. First of all, I want to sympathize with those who have been impacted. My purpose isn't to diminish what any layoff might mean for their personal lives and situations. Instead, I'm going to attempt to offer a headline alternative away from the doom and gloom sensationalism. The below is an excerpt I pulled from a lender contact of mine, Kyle Bergquist of Cross Country Mortgage.
"...I do want to discuss what happened (recently) in the context of its potential impact on our Puget Sound Housing Market. Here’s the thing: The health of a local job market is absolutely imperative to the health of the local real estate market. Simply put: A strong job market drives demand for housing – it attracts new residents, and good wages can help a housing market gain value. With that said, we all know the inverse is also true – A bad job market is bad for housing. And if you were just rolling with the (recent) headlines, well, you’d think Seattle’s local economy was about to become a zombie graveyard.
Here’s the thing with corporate layoff headlines: Amazon HQ1 is here in Seattle (and HQ2 in Bellevue) so we immediately think doom and gloom when we see a headline stating 30,000 corporate layoffs. But did you know that Amazon has over 350,000 corporate employees worldwide?!? Only 64,000 of those corporate employees are here in Puget Sound (50,000 in Seattle, 14,000 in Bellevue). So obviously the number isn’t going to be 30,000 HERE in Puget Sound - It’s up to 30,000 worldwide…or 14,000 worldwide?... I don’t know what the actual number is anymore, but I do know it’s only 2,303 layoffs here in Puget Sound.
Again, really terrible for all those employees – I don’t want to take that away from them; BUT if we’re looking at this purely through the lens of how this might impact our local housing market, then it’s important to know that most employees who were affected will have 90 days to look for a new role internally. During that time, Amazon recruiting teams will be prioritizing internal candidates, and according to Amazon’s job board, there are currently 11,048 open jobs posted. Why doesn’t the media talk about that more?
The headlines we don’t get are how many people were hired in any given month. We get all the bad news, with very little good news."
While definitely unfortunate, I don't believe these layoffs are the fuse that's going to set off a firework of declining home values. Anecdotally, I have buyers experiencing massive competition for certain homes in certain areas well above $1,000,000. As I've (hopefully) made clear in past reports, property type and location are returning to paramount importance when buyers are home shopping.
Onto the stats:
Seattle: In October, the median sale price for a Seattle SFR was, $1,049,999. This is the second highest median sale price of all time! This was up 8% YoY and up MoM from $975,000. Inventory was up 21% YoY while the months of inventory decreased to 2.3 months from 3.08 in October. Watch for falling months of inventory over the next few months! Also interesting is that the absorption ratio registered the LOWEST figure ever recorded in the 6+ years I've been keeping track. Low absorption yet a 2nd all-time high sale price? It seems counterintuitive.
Eastside: The median sale price was $1,550,000. That is exactly the same it was a year ago and down slightly MoM from $1,575,000. Inventory is still up significantly at 76.4% more homes on the market, but the months of inventory reduced to 2.39 months from 2.79.
King County: The median sale price was $997,000. That is up 3.9% YoY and up MoM from $957,000. Inventory is up 33.1% YoY and the months of inventory decreased to 2.29 months from 2.76 the month prior.
Have an amazing Thanksgiving! Onward!