Greater Seattle Housing Market Update — August 2025
Welcome to the latest edition of the Greater Seattle Housing Market Update. As always, to skip the good stuff and go right to the latest figures for August, you can do so by clicking here. For more analysis, continue below!
This Seattle Times article was published on September 5th and it breaks down, very simplistically, the diverse real estate market that we're experiencing (bonus points if you noticed I'm quoted in this article). Perhaps more than ever since I've been a realtor, factors like location and property type are increasingly influential when factoring in time on market, and thus seller expectations. I've discussed this before in past market updates, but can't stress enough how important it is to paint finely as opposed to broadly when breaking down the local housing market.

I know the above isn't the prettiest, but bare with me. I want to include the connection between three variables: the median sale price, months of inventory, and median days to sell over the past 6+ years. What we see is a little different from what I would have expected.
Thinking back to our ECON 101 classes, we're reminded of the fundamental dynamics of supply and demand and I know nobody reading this is a stranger to the supply/demand relationship within housing. Especially over the last few years. But is the market cooling, or is it gaining strength? There are plenty of articles saying one thing or the other. So which is it?

In a vacuum, the higher the months of inventory goes, the more prices should remain neutral, or even drop. Instead, they're hovering around all-time highs. In fact, the city of Seattle has posted a $1,000,000 or higher median sale price for 6 consecutive months! There are only 3 months where Seattle has hit $1,000,000 or higher (ever!) and those months happened between April and June of 2022, which was the absolute peak of the market when buyers knew interest rates were on the rise and competition was fierce before rates got to a point that leveled demand. Given the financial hurdles over the past 3 years, I find Seattle's surge in the median sale price to be simply fascinating.
In past reports, I've proven that we have to dig a little deeper to find the truth with what's happening and showed that much of the increased inventory are townhomes. Land is king and homes that don't share walls and sit on lots big enough for yards, parking, etc, it's those homes that are becoming increasingly scarce, and thus disproportionately valuable relative to townhomes. To take it a step further, I wanted to also highlight a metric we haven't yet talked about. The homes that AREN'T selling.

Imagine that! Homes that actually don't sell during their time on the market. Believe it or not, this happens. My question; is this happening in greater numbers compared to previous years?

For context, I was only able to search listings that were canceled or expired within Seattle. There were too many results for King County and the NWMLS limits me whenever the data returns 5,000+ results.
Obviously we don't know just how 2025 will end up, but I'm a little surprised to see that there aren't more home listings being cancelled or expired in recent years compared to pre-pandemic years. So far, my theory that more homes were being listed and NOT selling, doesn't seem to be true. Darnit. Perhaps it's just they're taking longer to sell? That's a topic for another month.
One variable that could be a HUGE push for buyers is interest rates. At the time I'm creating this, mortgage interest rates are at their lowest levels in almost a year. The labor market is finally showing the cracks so many had expected were there and that's driving investors to the bond market, pushing mortgage rates lower. TLDR: economic turmoil, including poor job/labor figures, are generally positive for lower mortgage rates.
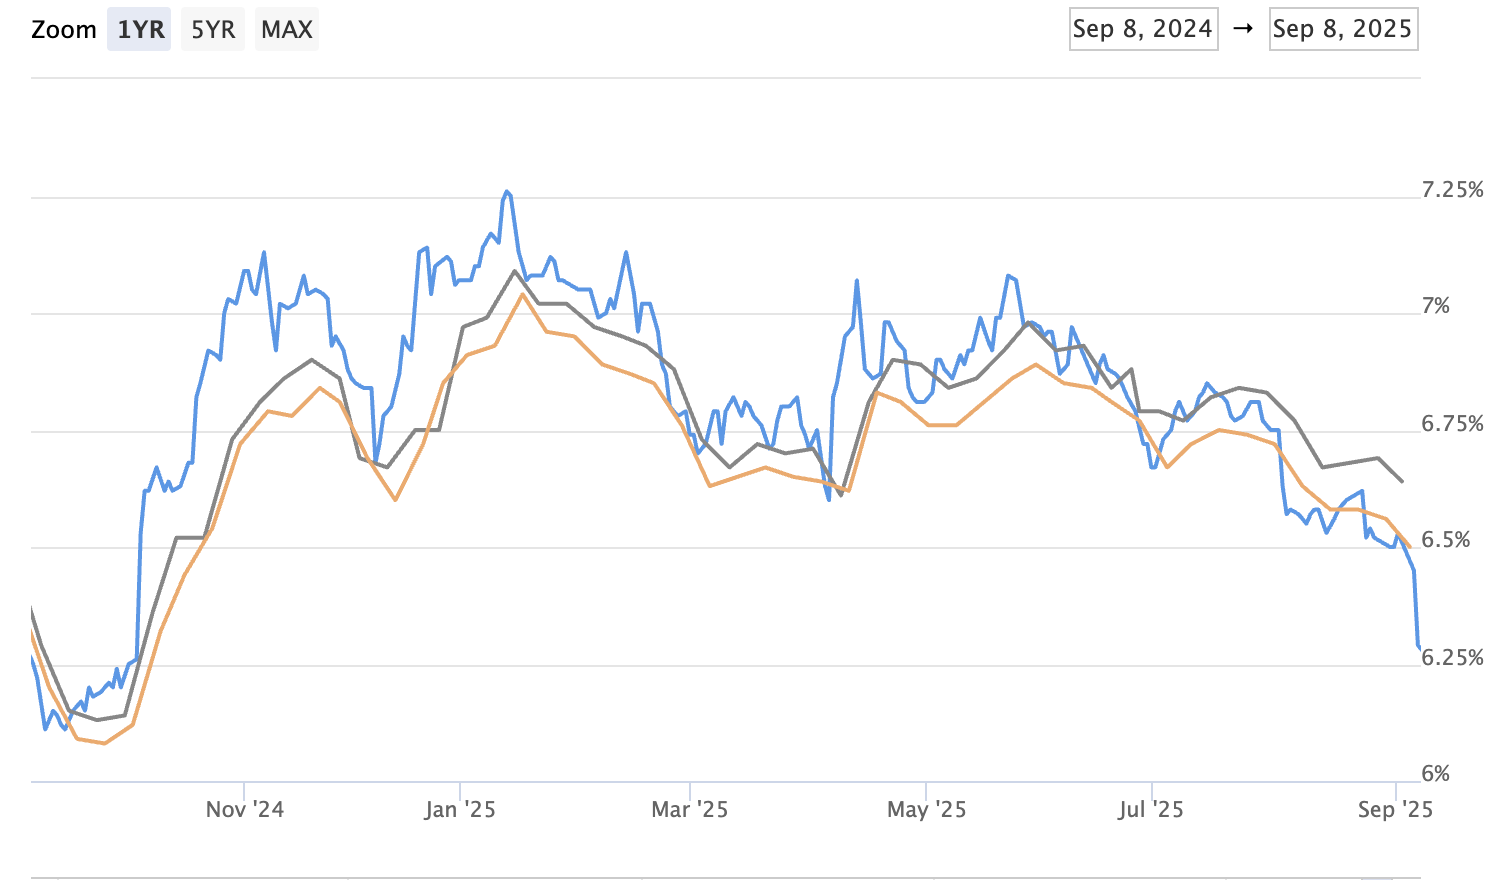
See the downward trend in the 30 year fixed above. Not satisfied? Still waiting for rates to drop below 6% before making a move? Well, we're already there...in a way. See below
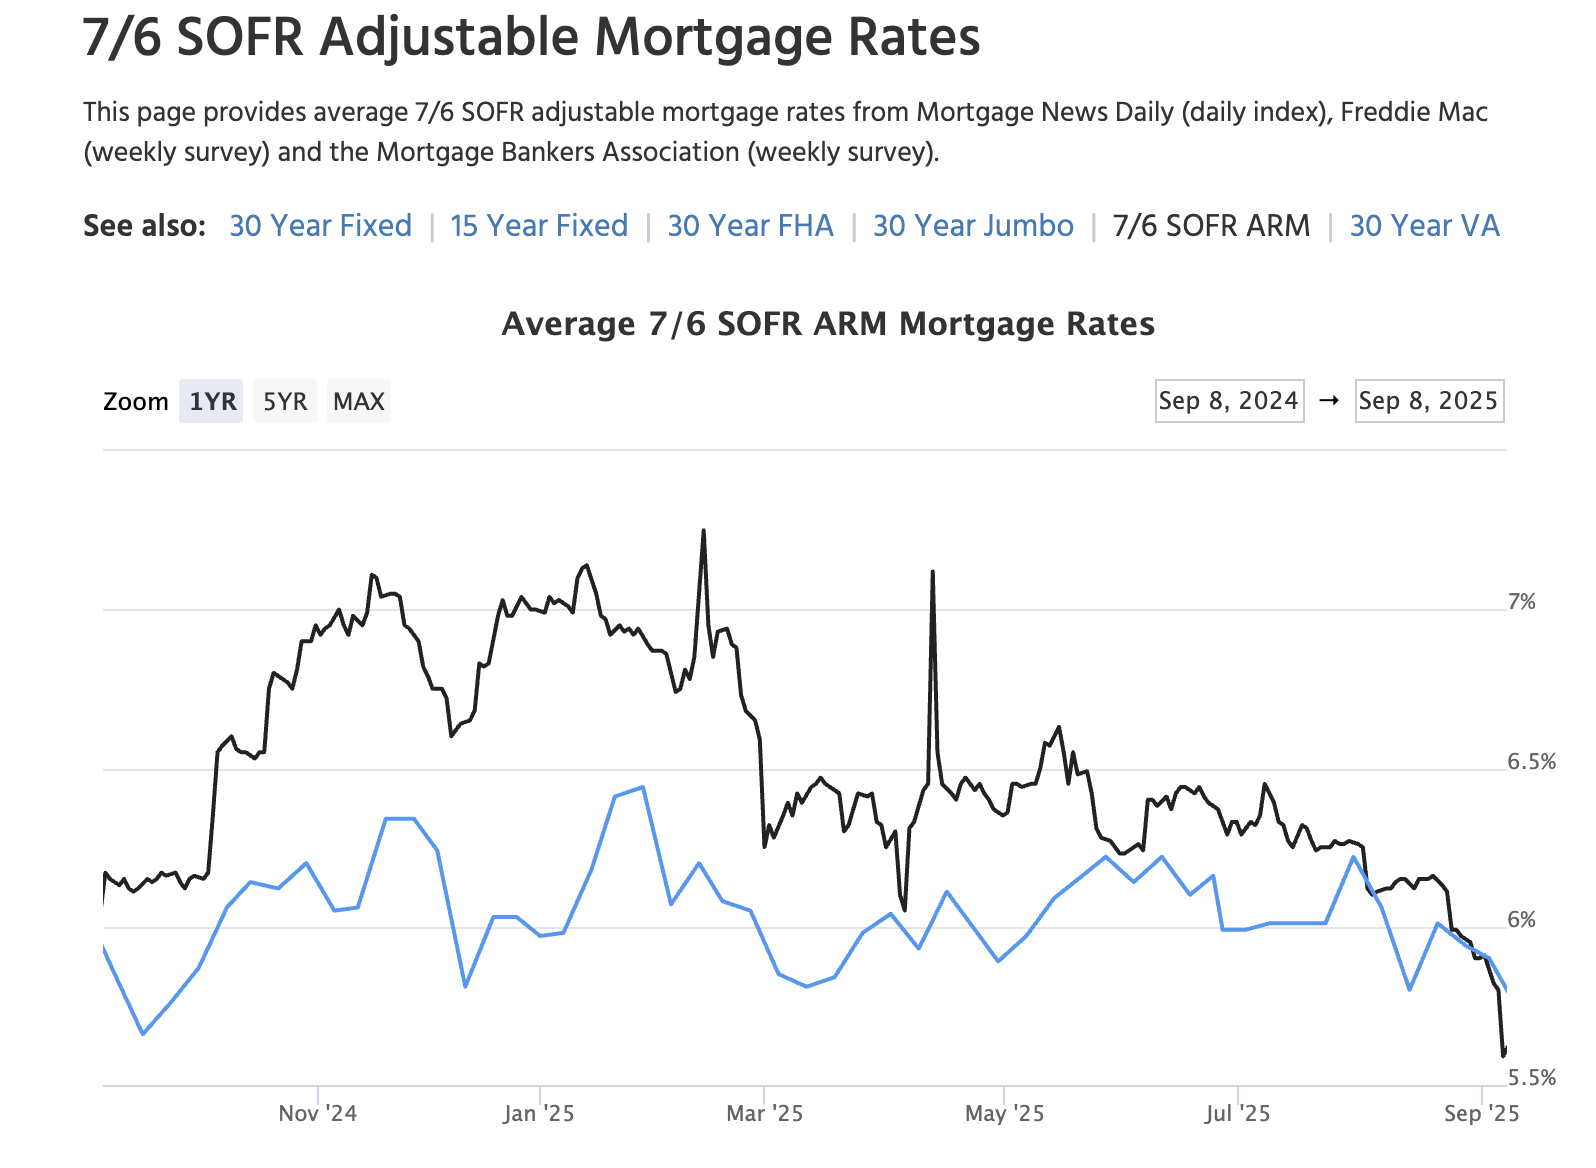
Remember ARM loans? ARM = Adjustable Rate Mortgage. These are mortgages that are fixed for a certain period of time (7 years in this example) and then adjust every year after that. For years, ARM's have been completely irrelevant. Not just during the time the 30 year fixed rate was under 4%, but even more recently when there wasn't much difference between a 30 year rate and an ARM. However, that's recently started to change.
ARM rates are now below 6% and the spread between the rate on a 30 year vs an ARM is increasing making ARM's more attractive than they've been in years. If you're a buyer who's been on the fence waiting for rates to drop, you might want to talk with a mortgage lender on what ARM rates look like and how you might be able to accelerate that home purchase. And for those of you worried that the ARM loans today are the same risky mortgages that induced the Great Financial Crisis of 2007-8, don't be. The qualification requirements to be approved for ARM loans today is a complete 180 degree difference compared to the loans that sank the global economy. In fact, it's harder to qualify for an ARM mortgage than a 30 year mortgage!
Nevertheless, a .5%-.75% difference on a mortgage of $800,000 can be significant. A $260/month savings at a 6% rate compared to 6.5%. Additionally, $128/month difference in 5.75% vs 6%. Roughly a potential $375/month difference in 7/1 ARM interest rates vs 30 year fixed rates. I would definitely recommend looking at ARM's to buyers who KNOW they're not going to own the home for the entire fixed rate period, or if they plan on paying off that mortgage before the loan adjusts. Something to think about.
Onto the stats!
Seattle - The median sale price for a SFR in August 2025 was $1,000,000. That is up 7.5% YoY, and down just $10,000 MoM. Inventory is up 17.4% YoY and the months of inventory stat was flat MoM currently sitting at 2.25 months. Worth noting, the absorption rate was the LOWEST I have seen in my 6+ years measuring these stats.
Eastside - The median sale price in August was $1,537,500 (the lowest since November). That is down .8% YoY and down MoM from $1,580,000. Inventory is up 68.8% YoY and the months of inventory increased MoM to 2.68 months from 2.54.
King County - The median sale price in August was $990,000. That is up 3.67% YoY and down just $10,000 MoM. Inventory is still up 32.4% YoY and the months of inventory was stagnant MoM, currently sitting at 2.47 months.
Enjoy our last month of summer. Fall is upon us! Onward!